

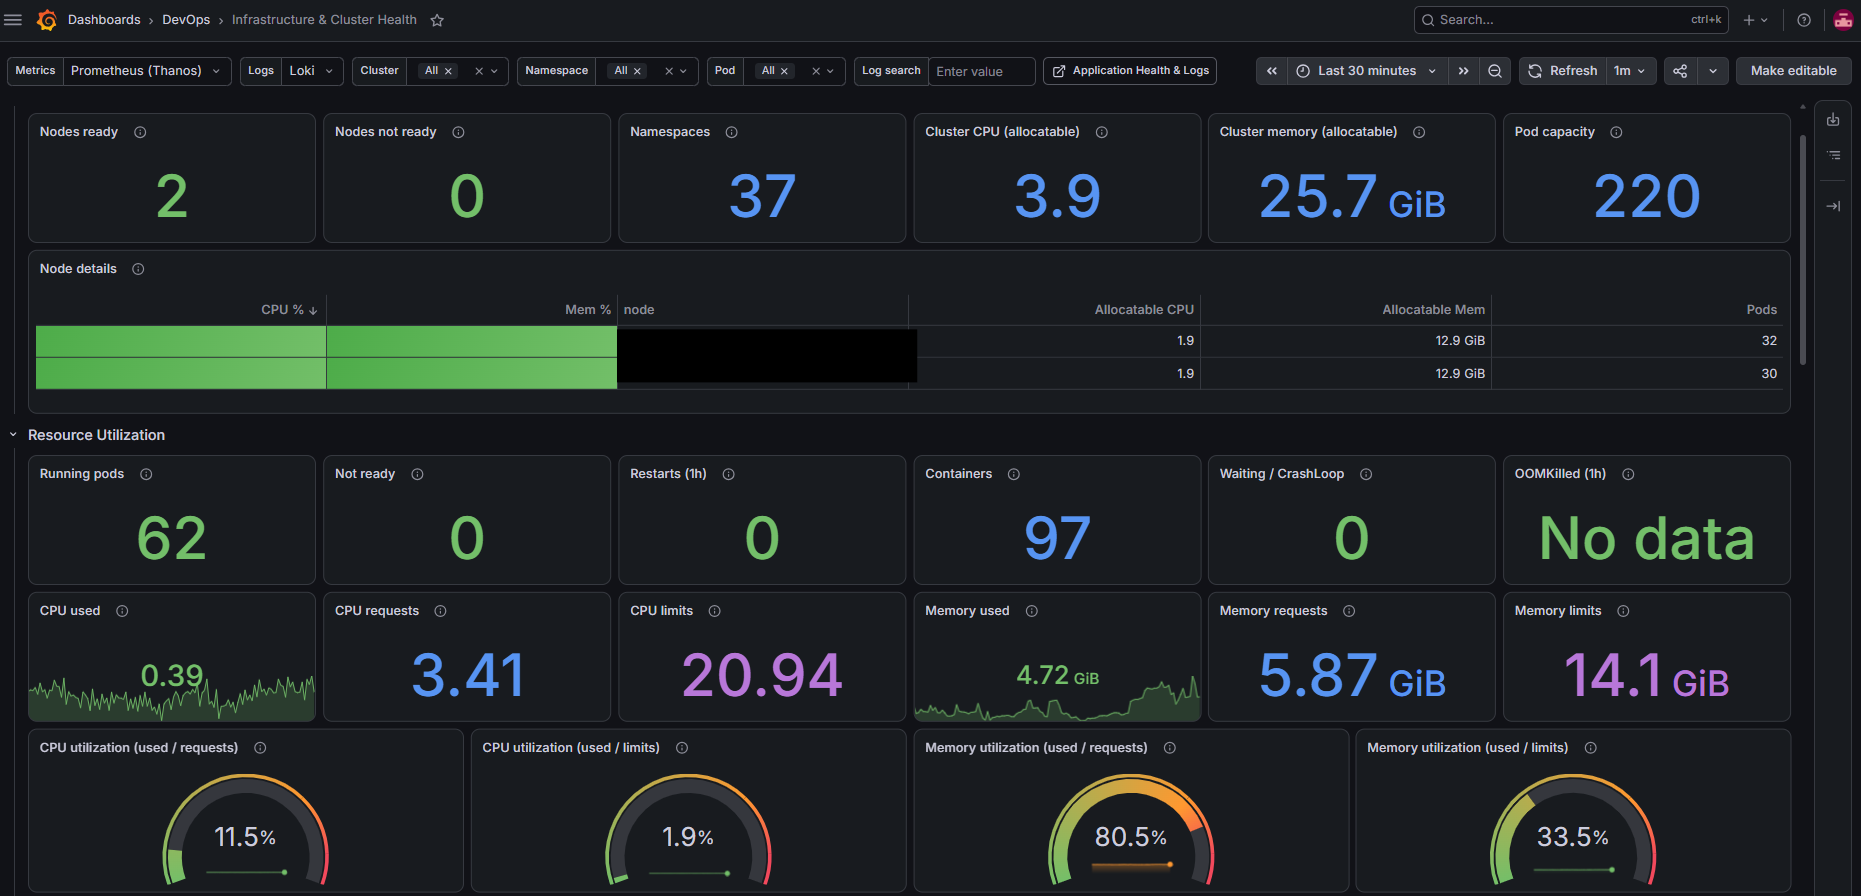
A resilient Kubernetes monitoring architecture relies on decoupling short-term local scrape buffers from long-term object storage. By combining kube-prometheus-stack, Thanos, Loki, Alloy, and Grafana, you establish a horizontally scalable observability plane across development, staging, and production clusters while maintaining strict resource boundaries and compliance controls.
Component Dependencies and Deployment Order
Installing an integrated monitoring stack requires strict deployment ordering because downstream services rely on existing Kubernetes Services and DNS endpoints to auto-wire data paths. Deploying components out of order leads to initialization failures and broken discovery.
The strict deployment sequence is:
kube-prometheus-stack: Provisions Prometheus, the Prometheus Operator,node-exporter,kube-state-metrics, and the Thanos sidecar.thanos: Deploys Thanos Query, Store Gateway, and Compactor. Query auto-wires to the Prometheus sidecar deployed in step 1.loki: Establishes the log storage backend using Google Cloud Storage (GCS).alloy: Installs the log collection DaemonSet that tails node logs and ships them to Loki's gateway.grafana: Deploys the visualization engine, pre-configured with datasources for Thanos Query and Loki Gateway.
Metrics Layer: Short-Term Buffering and Long-Term Offloading
Prometheus instances in individual clusters act purely as transient scrapers. Long-term data retention, compaction, and cross-cluster query federation belong in object storage managed by Thanos.
In kube-prometheus-stack, local TSDB retention is set to a 2-day buffer. A Thanos sidecar runs inside the Prometheus pod, continuously shipping 2-hour TSDB blocks to a designated GCS bucket (gs://k8s-monitoring-<env>). Thanos Query runs in its own namespace (thanos) and dynamically discovers local sidecars across namespaces via the kube-prometheus-stack-thanos-discovery DNS-SRV service. Store Gateway handles cold historical data queries from GCS, while Compactor handles downsampling (5-minute resolution retained for 30 days, hourly resolution retained for up to 10 years).
To prevent version mismatch issues between Bitnami repackaged image tags and upstream sidecars, Thanos components are pinned explicitly to upstream image version v0.42.4 (quay.io/thanos/thanos), setting global.security.allowInsecureImages: true in Bitnami's chart. Authentication avoids long-lived secret keys by utilizing GCP Workload Identity, mapping individual Kubernetes ServiceAccounts (thanos-storegateway, thanos-compactor, and prometheus) directly to Google Service Accounts.
Thanos Cost & Resource Economics
The only extra cost Thanos adds to an existing Prometheus setup is essentially the price of storing and querying data from object storage and running the store node.
- Compute Parity: Queriers, compactors, and store nodes require approximately as many compute resources as they save by not doing the same work directly on Prometheus servers.
- Network Overhead: Data that is accessed locally in conventional Prometheus setups is transferred over the network in Thanos, typically happening in unmetered internal networks.
- Object Storage Pricing: Typical object storage prices per GB are ~$0.02. Adding 20% to total storage cost accounts for retrievals ($0.004 per 10,000) and running store nodes.
Capacity Calculations (100TB Metric Data at ~1.07 bytes/sample):
Assuming 1 million active time series:
- 15s Scrape Interval (4 samples/min):
- 1s Scrape Interval (60 samples/min):
Storing 100TB costs ~$2,400/month on top of baseline Prometheus. In return, reducing Prometheus retention from weeks to hours provides substantial savings on local SSD / network block storage ($0.17/GB) while lowering memory consumption.
Logging Layer: Lightweight Footprint and Compliance Retention
Running full microservices-based logging setups on small-to-medium clusters introduces unnecessary compute overhead. Using Grafana Loki in SingleBinary mode provides a compact footprint while offloading chunk and index storage to cloud object stores.
Loki uses TSDB schema v13 backed directly by GCS, keeping local persistent storage requirements minimal by storing only the write-ahead log (WAL) and index caches on local Persistent Volume Claims (PVCs). Resource consumption is optimized further by disabling default Memcached instances (chunks-cache and results-cache), saving 16Gi of allocated memory per cluster.
Log retention is aligned with ISO 27001:2022 A.8.15 requirements: 90 days (2160h) for development and staging, and 1 year (8760h) for production. To guarantee compliance even if application-level compaction fails, retention is backstopped out-of-band via GCS bucket lifecycle rules. Container logs are gathered by the Grafana Alloy DaemonSet deployed across all nodes and pushed into loki-gateway.
Visualization and Platform Integration
Visualizing telemetry requires robust ingress routing, zero-downtime upgrades, and strict access controls.
Grafana is installed using the maintained grafana-community/grafana Helm chart (12.10.4, app 13.1.3) rather than deprecated repositories. Traffic ingress is managed through Envoy Gateway via native HTTPRoute resources, offloading TLS termination to cluster-level wildcard certificates.
Because Grafana runs as a single replica backed by a ReadWriteOnce (RWO) PVC, using standard RollingUpdate deployment strategies results in Kubernetes volume attachment deadlocks during upgrades. The deployment strategy is explicitly set to Recreate to ensure the old pod releases the RWO volume before the new pod attempts to attach it.
Authentication is secured with GitLab OAuth, restricting access via allowed_domains (acme.com, acme.cloud) and mapping user roles dynamically from GitLab group memberships. Local administrative credentials remain accessible via break-glass settings (disable_login_form = false).
System Architecture & Data Flow
graph TD
    subgraph Visualization & Ingress
        G[Grafana]
    end

    subgraph Query & Aggregation Gateways
        TQ[Thanos Query]
        LG[Loki Gateway]
    end

    subgraph Metrics & Scrapes
        P[Prometheus TSDB<br/>Hot Buffer 2d]
        TS[Thanos Sidecar]
        SG[Thanos Store Gateway / Compactor]
    end

    subgraph Logging Engine
        A[Grafana Alloy DaemonSet]
        LSB[Loki SingleBinary<br/>WAL / Local PVC]
    end

    subgraph Cloud Object Storage
        GCS[(Google Cloud Storage<br/>gs://k8s-monitoring-env)]
    end

    G -->|Query Metrics| TQ
    G -->|Query Logs| LG

    TQ -->|Live / Local Scrape| TS
    TQ -->|Historical Data| SG

    P -->|2h Blocks| TS
    TS -->|Ship Blocks| GCS
    SG <-->|Read / Downsample| GCS

    A -->|Push Logs| LG
    LG -->|Write Chunks| LSB
    LSB -->|Chunk & Index Storage| GCS
Observability Standards, SLIs, and Symptom-Based Alerting
Dashboards follow a structured drill-down hierarchy aligned with Grafana Dashboard Best Practices: HTTP Overview (RED metrics), Envoy Gateway Ingress, and Namespace Workloads (USE metrics).
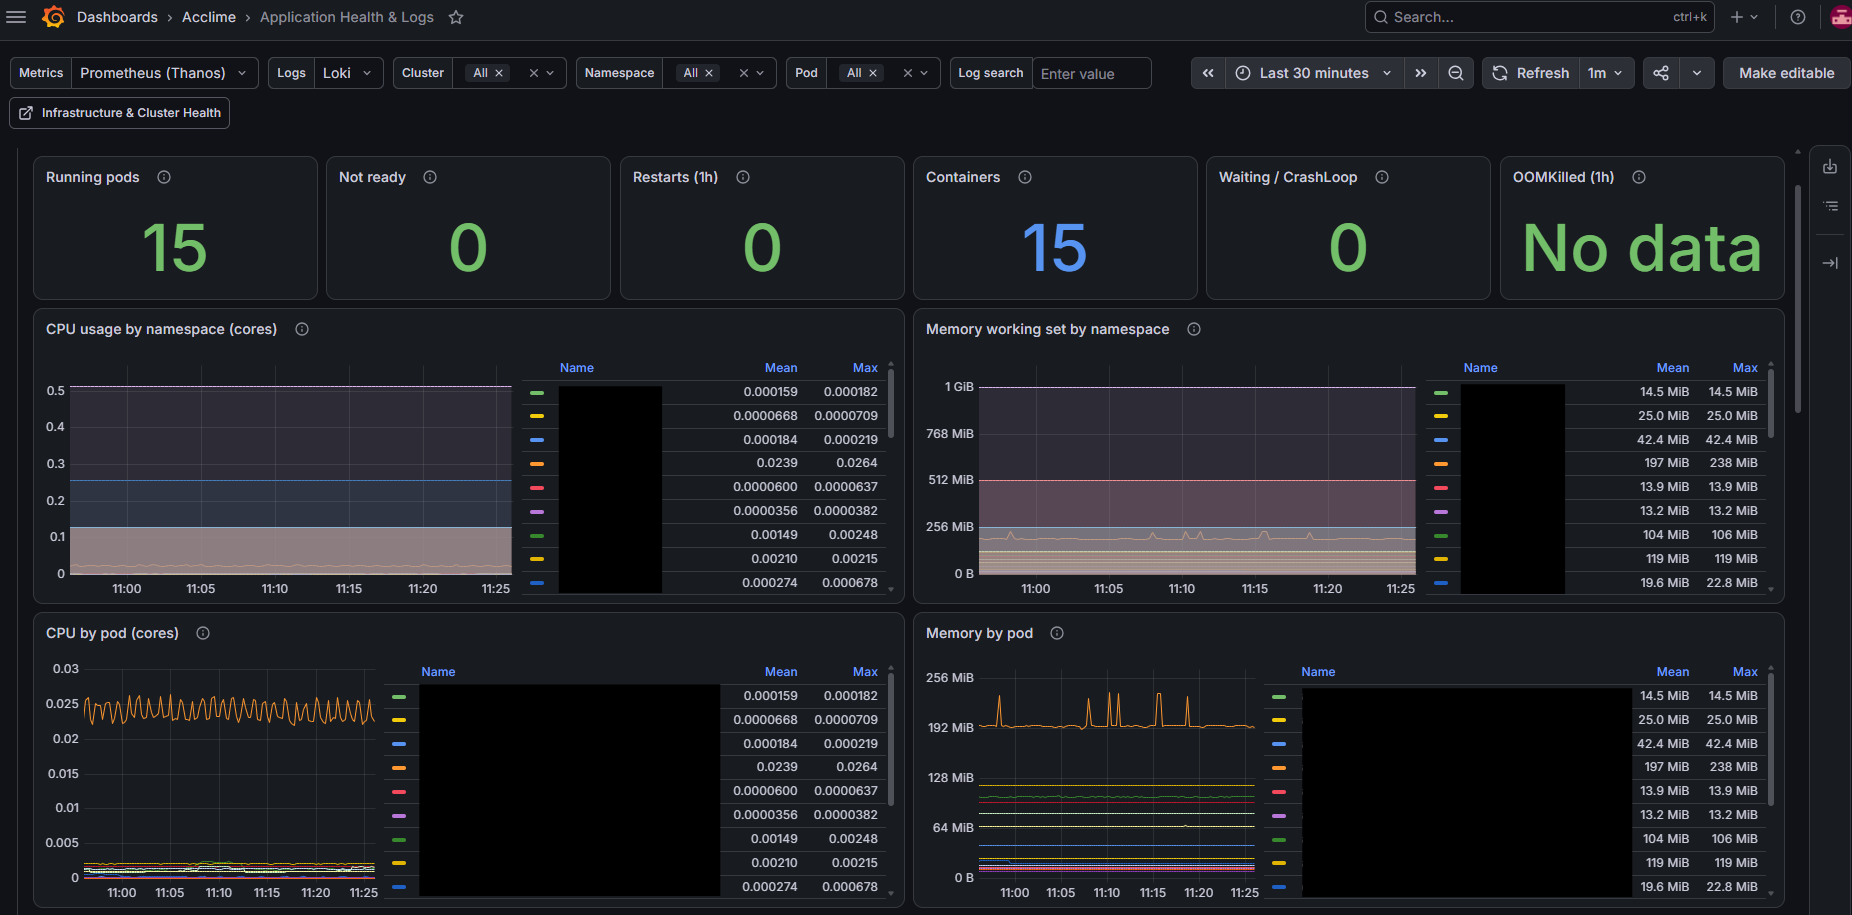
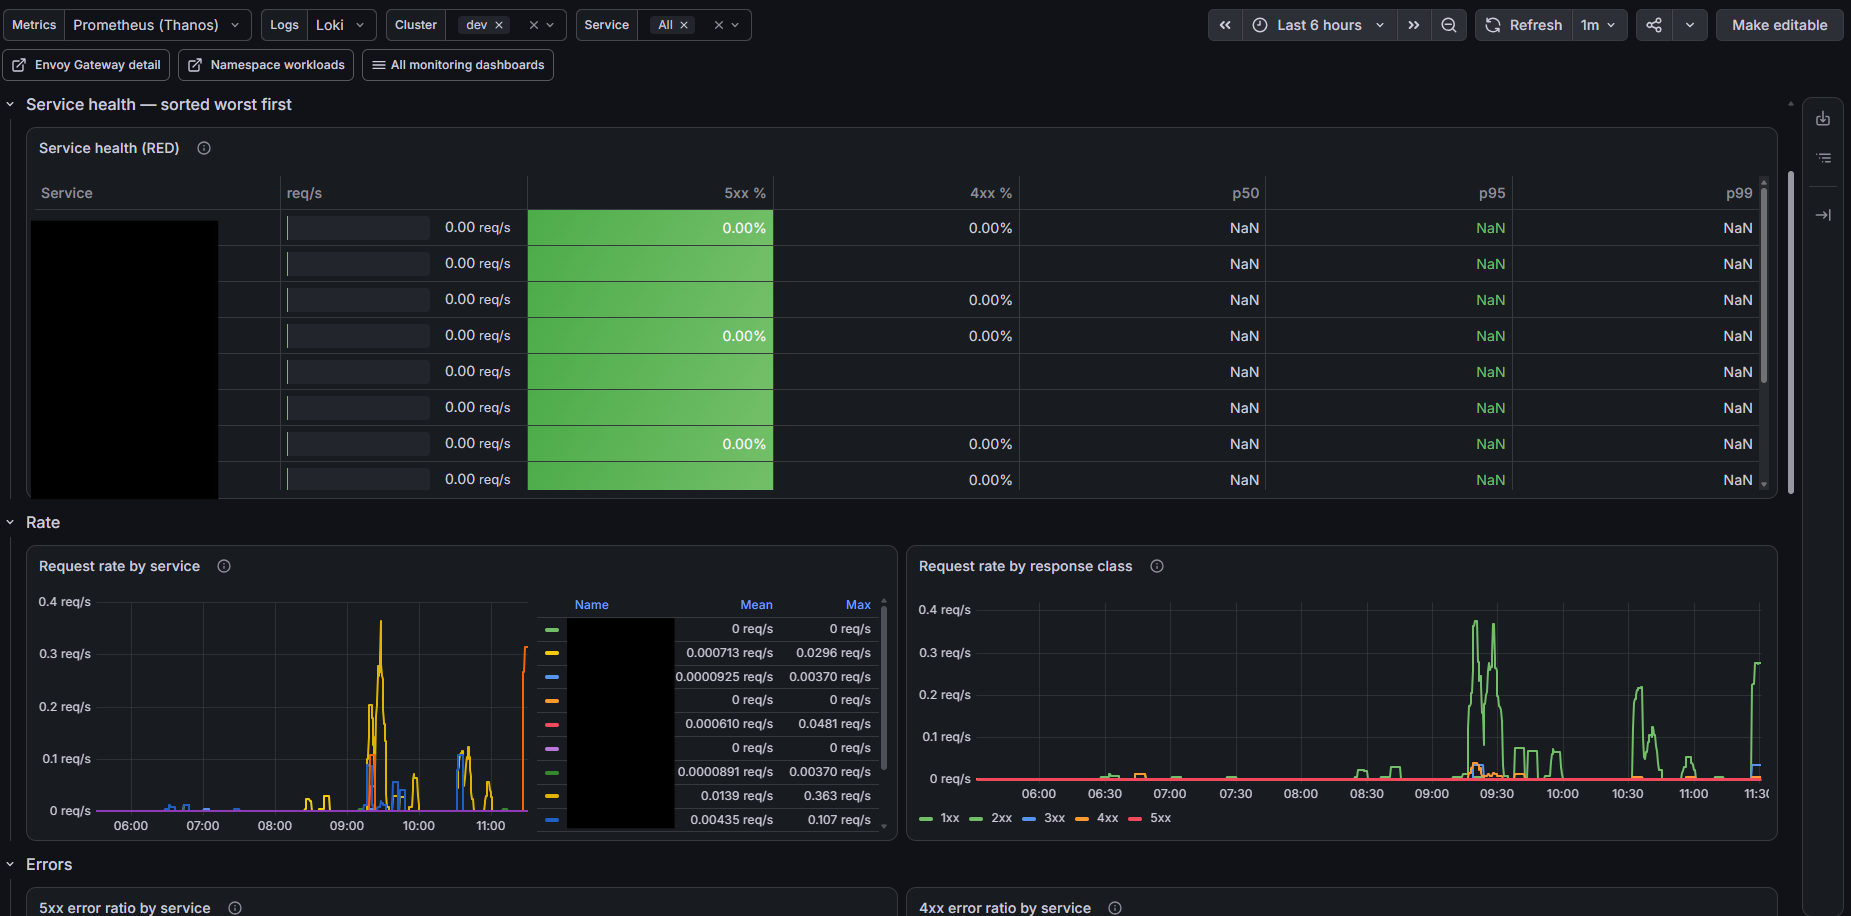
Ingress traffic is monitored by scraping Envoy proxies via dedicated PodMonitor CRDs and aggregating traffic metrics into standardized service:http_* series using Prometheus recording rules. Service Level Indicators (SLIs) and Objectives (SLOs) are tracked over rolling 30-day windows:
- Availability SLO:
non-5xx HTTP response ratio. - Latency SLO: p95 upstream response time
, and of requests completed within .
Alerts fire on user-impacting symptoms rather than arbitrary resource thresholds. For example, HighHttp5xxRate triggers when error rates exceed 5% for 10 minutes (indicating an ~10x error budget burn rate), while HighHttpLatency triggers when p95 latency exceeds 2 seconds for 15 minutes. Alerts evaluate in Alertmanager, which comes pre-enabled in the cluster stack.
Key Takeaways
- Storage Decoupling: Offloads long-term TSDB metrics to GCS, eliminating node disk overhead and large local volume risks.
- SingleBinary Logging: Reduces operational complexity and memory footprint compared to microservice modes while remaining ISO 27001 compliant.
- Deployment Safety: Uses
Recreatedeployment strategies on single-replica RWO workloads to avoid PVC attachment deadlocks during Helm upgrades. - Upstream Image Pinning: Pins Thanos images to upstream
quay.ioreleases to avoid version drift from third-party chart repackaging. - Stateless Query Aggregation: Delegates historical and cross-cluster query deduplication to Thanos Query for a clean single-datasource setup.
Concrete Improvement Advice
- Configure Alertmanager Receivers: Alertmanager is running and evaluating rules, but lacks configured outbound notification channels. Add explicit Slack or Webhook receivers to
values.yamlunderalertmanager.config.receiversto route critical alerts. - Eliminate Public Egress Dependencies at Startup: Grafana's init container downloads dashboards
315and6417fromgrafana.comon startup. Bundle dashboard JSON files locally in the repository and deploy them via Kubernetes ConfigMaps tagged withgrafana_dashboard: "1"usingapply.sh. - Harden OAuth Access Controls: Transition from domain-based access gating (
allowed_domains) to explicit group gating (allowed_groups) in Grafana's OAuth settings once team structures stabilize in GitLab.
External References
| Source / Resource | Link | Description |
|---|---|---|
kube-prometheus-stack Helm Chart | prometheus-community/kube-prometheus-stack | Helm chart for Prometheus Operator, Prometheus, node-exporter, and Alertmanager. |
| Thanos Helm Chart | bitnami/thanos | Helm chart for Thanos Query, Store Gateway, and Compactor. |
| Loki Helm Chart | grafana/loki | Helm chart for Grafana Loki log aggregation system. |
| Alloy Helm Chart | grafana/alloy | Helm chart for Grafana Alloy telemetry collector. |
| Grafana Helm Chart | grafana/grafana | Maintained Helm chart for Grafana visualization platform. |
| Thanos Project | thanos.io | Highly available Prometheus setup with long-term storage capabilities. |
| Grafana OSS | grafana.com/oss | Open-source visualization and logging platform overview. |
| Grafana Best Practices | Dashboard Best Practices | Official design patterns for structuring production dashboards. |